What are the prime reasons that generated the married men's bias against Hillary? This question becomes much more significant given that this syndrome was largely absent among the unmarried men, says Subhamoy Maitra.
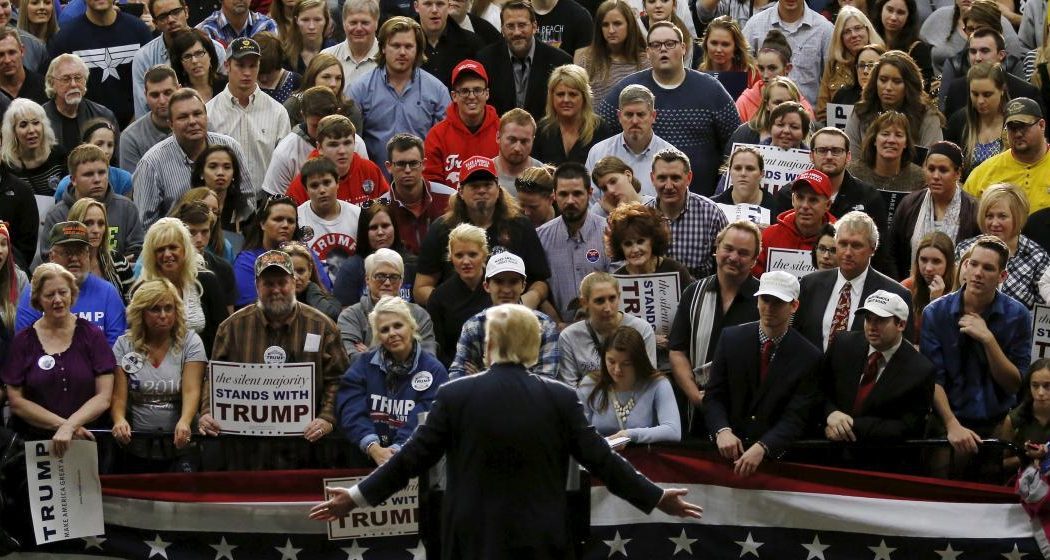
The curve of interest quotient towards an important election is Bell-shaped with respect to time. Long before the election days, there is little interest. As we close the gap on the time-line, the interest rises. We start getting more and more surveys to guess the uncertainty ahead. The excitement peaks during the election days. Once the counting is over, the uncertainty vanishes. With each passing day, the number of words in various media outlets slowly precipitates. Given the exponential growth in the domain of computer and internet, the political analysis is now mostly quantitative than qualitative. There is less discussion on polity and policy now-a-days, but the focus is more towards data. For example, instead of studying the so-called `social justice’ of Mayawati from political viewpoint, we would be more interested to know what will happen if 2.5% of vote gets transferred from SP to BSP in the upcoming UP election.
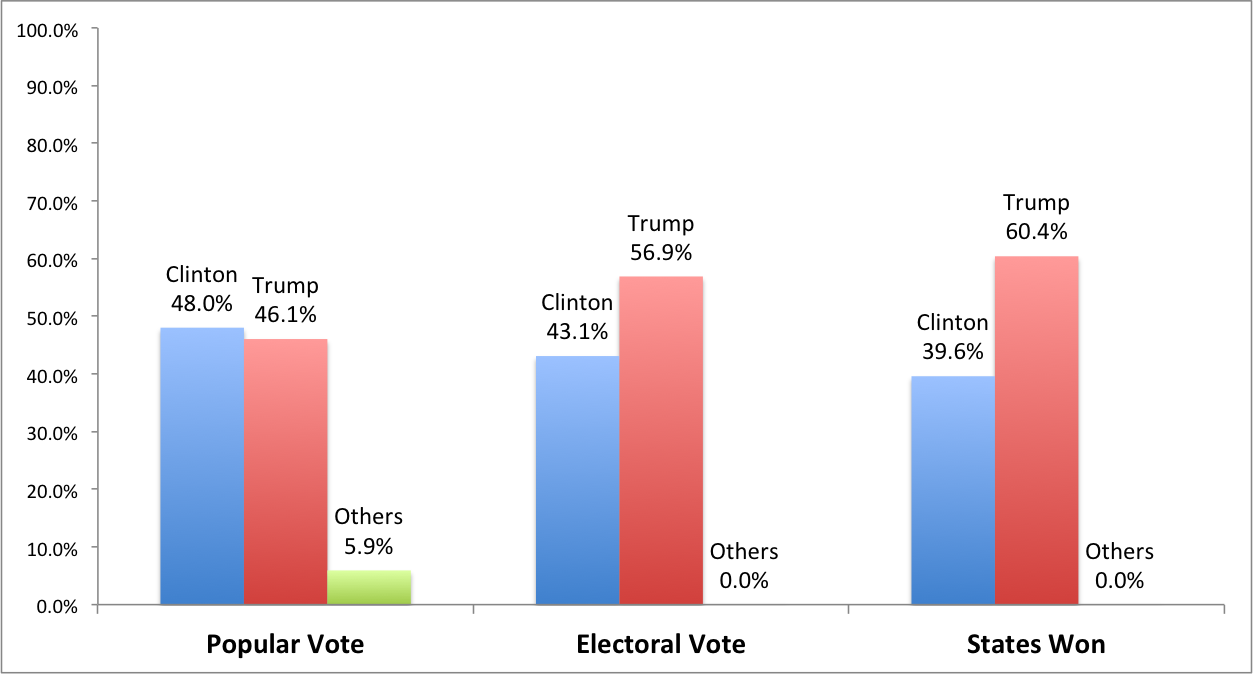
By itself, the US election result of this year presents a classic example of “less vote, more seat” scenario. This is generally a low probability event that happens very rarely. US election statistics have now confirmed that Trump possibly polled around two million votes (this is known as popular vote) less than Hillary (almost two percentage points) but won by a healthy margin of seats (referred to as electoral vote).
When we have a lot of data, one must do something with that instead of just sitting over it. You may be pleased to correlate the gain in vote percentage of ‘Didi’ with the number of researchers produced in China since 1980’s. Don’t get surprised if you discover a nice positive correlation. This is statistics, related to the perpetual theorem: “There are three kinds of lies: lies, damned lies, and statistics”. In fact, now some websites regularly list spurious correlations and one may surprisingly note considerable similarity between the number of “honey producing bee colonies” and “juvenile arrests for possession of marijuana” in US. Old proverb made new, we may now have a statement like “There are three kinds of truths: truths, half truths and statistics”. For the politicians, truth varies with time. For example, the half truths of Trump now become eternal ones after his victory. However, at a given snapshot of time, if the data can be investigated minutely, certain facts might surface. Related to election analysis, the data that you obtain after the election could be a logical platform for such fact finding. It is not possible for an individual to go through each and every data point related to an election. Rather, we mostly depend on summarized result. By itself, the US election result of this year presents a classic example of “less vote, more seat” scenario. This is generally a low probability event that happens very rarely. US election statistics have now confirmed that Trump possibly polled around two million votes (this is known as popular vote) less than Hillary (almost two percentage points) but won by a healthy margin of seats (referred to as electoral vote). There are still some minor legal hassles with this election, but that does not seem to affect the final result.
Though less frequently referred, the sensitivity of marriage on woman and mankind is surely the most interesting part in this US election. For example, this was pointed before the poll by Alex Wagner (The Atlantic, October 18, 2016) and later referred by Michelle Goldberg (October 28, 2016, Slate) where it has been stated that “Democrats will need white women to resist their husbands’ appeals for Trump”.
Among millions of snapshots of this very election, a particular observation requires serious attention.
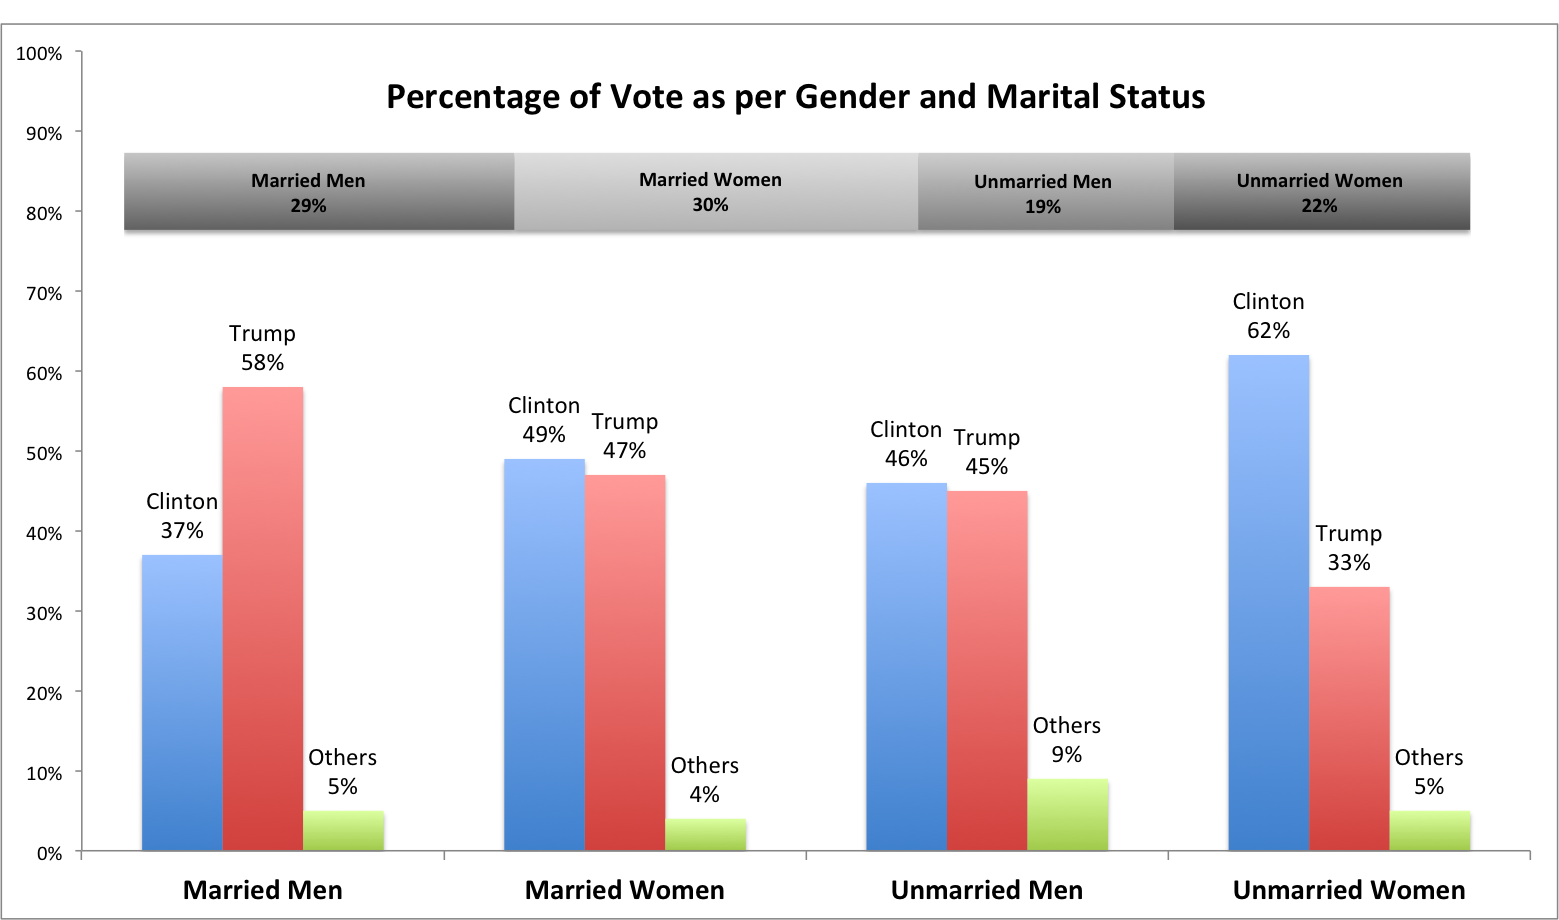
While, among the married women and unmarried men, there is not much difference between Hillary and Trump (at most two percentage points), the difference is huge in case of married men and unmarried women (more than 20%). Note that by the term ‘unmarried’, we mean ‘non-married’ here, that is both `single’ and `divorced’ status are included. The more frequent discussion in the media was on the prediction that women would vote more for Hillary than Trump and it would be the other way around for men. However, this is simplistic and does not portray the true picture of the voters’ sentiment. Though less frequently referred, the sensitivity of marriage on woman and mankind is surely the most interesting part in this US election. For example, this was pointed before the poll by Alex Wagner (The Atlantic, October 18, 2016) and later referred by Michelle Goldberg (October 28, 2016, Slate) where it has been stated that “Democrats will need white women to resist their husbands’ appeals for Trump”. Nicholas Ballasy (July 1, 2016, PJMedia) reported long back that Trump is far behind Clinton among unmarried women in swing states.
Consider the states of Wisconsin and Michigan. Here the Republicans’ last won in 1984 and 1988 respectively. This time they could turn the tide after a long time. Naturally social scientists will be in a much better position to analyse the cause and effect of this basic statistics. However, it is needless to mention that married men Trumped the unmarried women in this US election.
Finally Trump won though polling far behind Hillary considering the country of Uncle Sam at large. In the US election process, if one candidate polls the maximum share of votes in a state, then all the seats corresponding to that state are assigned to that candidate only. This is true in almost all the fifty states with the only exceptions in Maine and Nebraska. The same rule works for the three seats in Washington DC too. That is, one candidate can gather more votes by winning less number of states by bigger margins. The other candidate, with lower number of votes in nationwide count, can eventually win the election by coming first in more number of states with slender margins. In this election, this is possibly not a `low probability event’ that suddenly happened. There must have been a very thoughtful analysis by the team of Trump to observe and harvest this syndrome. The number of married men is significantly higher than that of unmarried women. There is a good possibility that the huge swing among the married men towards Trump crucially helped him in the marginal states. Consider the states of Wisconsin and Michigan. Here the Republicans’ last won in 1984 and 1988 respectively. This time they could turn the tide after a long time. Naturally social scientists will be in a much better position to analyse the cause and effect of this basic statistics. However, it is needless to mention that married men Trumped the unmarried women in this US election.
The skewness in the voting pattern for two groups, given that there is almost even result in the other two, is indeed statistically significant. Many research papers might be in waiting, but let us refer to a conversation overheard in last December at a conference in Kolkata. One Indian professor was talking with his US counterpart over the banquet. Both of them were little tipsy and it was almost midnight. Nevertheless, the Indian professor was still sober enough to clearly express his thoughts. “Good Night. Have a nice sleep. Tomorrow I will see you off at the airport. Unfortunately, I have to quickly return home. Now-a-days we sometimes crack a joke that my wife will beat me if she finds me drunk.” The US professor was shocked. “This is only a joke at your place!”- he exclaimed.
Jokes apart, the question that will ever haunt the analysts is: what are the prime reasons that generated the married men’s bias against Hillary? This question becomes much more significant given that this syndrome was largely absent among the unmarried men.
Thus, this is not simply a gender bias (justified by sexism), but certain dynamics that might have evolved from unmarried to married men. While we did not obtain the exact data, but it seems that bias against Hillary could be more prominent among the married men who are white. The libertarian approach of Democrats’ indeed influenced the cosmopolitan culture along both the coasts of the United States and they won significantly in those areas. However, this could have irritated a large part of native white (married) Americans as one moves far from the coasts towards the central region. Naturally, the sons of the soil would expect a society with less interference of foreign immigrants to have better access to jobs, as duly promised and campaigned by Trump and his associates.
On the other hand, the result underlines a landslide victory of Hillary among the unmarried women. Again, we could have a simple argument that it is natural that women would love to see the first women president of USA. Unfortunately this does not stand, as among the married women such bias is visibly absent. Thus a complementary question here is: What exactly generated the bias of unmarried women against Trump? This might have a better answer. The kind of
Trump’s image, portrayed worldwide by international media, is mostly guided by blunt male-chauvinism. A part of it has been highlighted by media houses who worked for Hillary. This increased the support base of Hillary among the unmarried women, but possibly backfired among the married men.
Hillary is indeed not the best of the candidates. Still, the simple arithmetic of higher count (more than two millions) in popular votes towards the former first lady cannot be erased by the presidential selection of Trump through US voting mechanism.
In the context of US election result, one may now restate that male chauvinism is a belief that (married) men are superior to (unmarried) women and statistics can always be exploited to prove or disprove such a hypothesis. Hillary is indeed not the best of the candidates. Still, the simple arithmetic of higher count (more than two millions) in popular votes towards the former first lady cannot be erased by the presidential selection of Trump through US voting mechanism. The world runs after the winner. Thus, it is needless to mention that Trump is the TIME person of the year 2016. Michael Scherer writes (December 7, 2016) in TIME:
“For all of Trump’s public life, tastemakers and intellectuals have dismissed him as a vulgarian and carnival barker, a showman with big ash and little substance. But what those critics never understood was that their disdain gave him strength. For years, he fed on the disrespect and used it to grab more tabloid headlines, to connect to common people.”
The married men are not the only examples of common people. Unmarried women belong to this class too and it is now certain that Trump could not connect them. Thus, the choice of Trump as the almighty US president sounds ‘Hilarious’.
To conclude, the final list of eleven nominees (for the person of the year in 2016) by TIME included six politicians, namely Hillary, Erdogan (the Turkish president who survived the unsuccessful military coup), Farage (head of the U.K. Independence Party who successfully campaigned for Britain to leave the European Union), Modi, Putin and Trump. The lady missed the bus (‘odd woman out’?). The five rightist men are left, led by mighty married Trump.
Image via http://theweek.com
Related